Create a new project
Create a new project and learn about the various project settings. Watch the tutorial video or feel free to read the instructions and follow along.
Need help?
Just contact us via the contact form below and we'll be happy to assist you.
How do I add a new project?
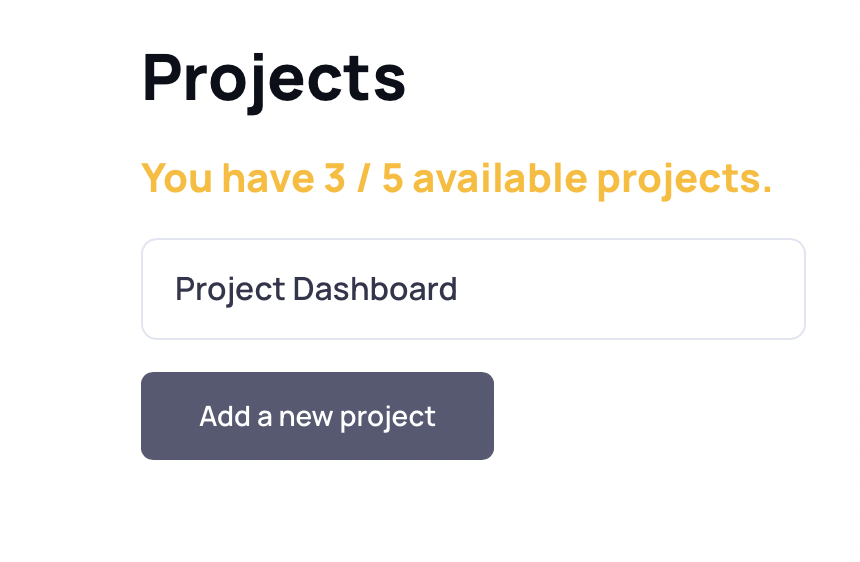
Click on the add new button
You can add a new project from the Account Dashboard or the Project Dashboard pages.
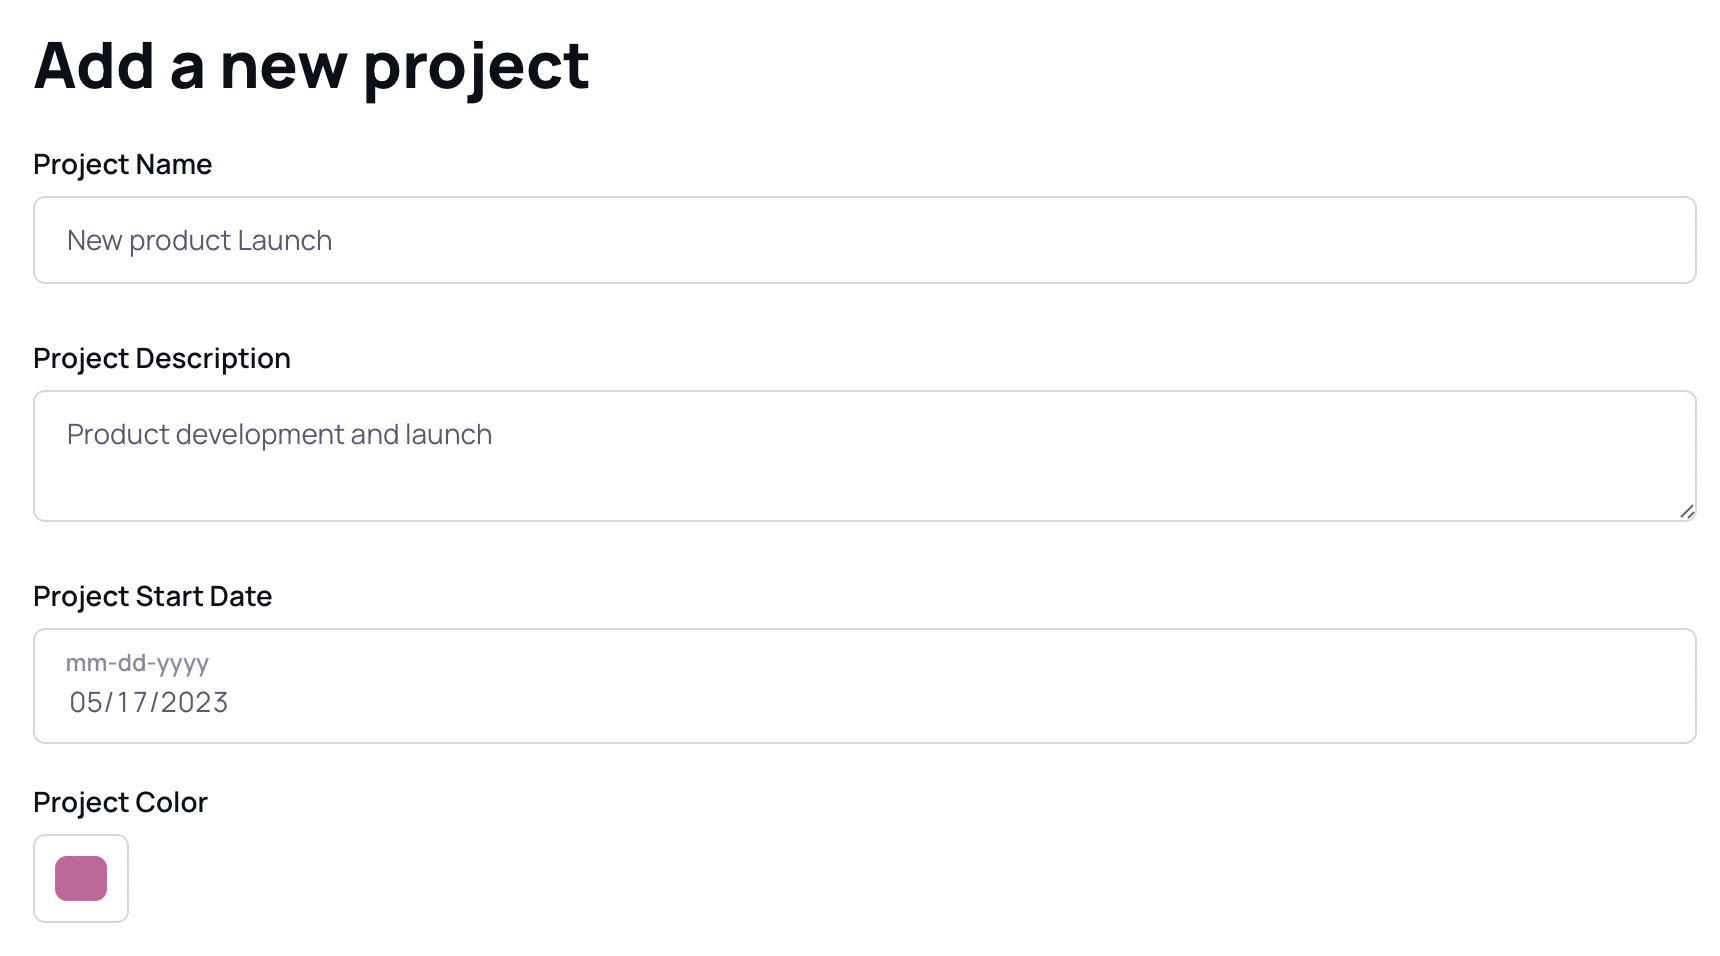
Add the basic project information
Add your project name, it's description and the start date. The start date will be used for all project projected date calculations. This date can be set in the past or the future. For example, all your tasks without a predecessor will start on this date.
Remember that these as well as any of the settings can always be changed later. You can leave the rest of the settings at their default values and just click "create a new project" at the bottom of the page.
Duration settings
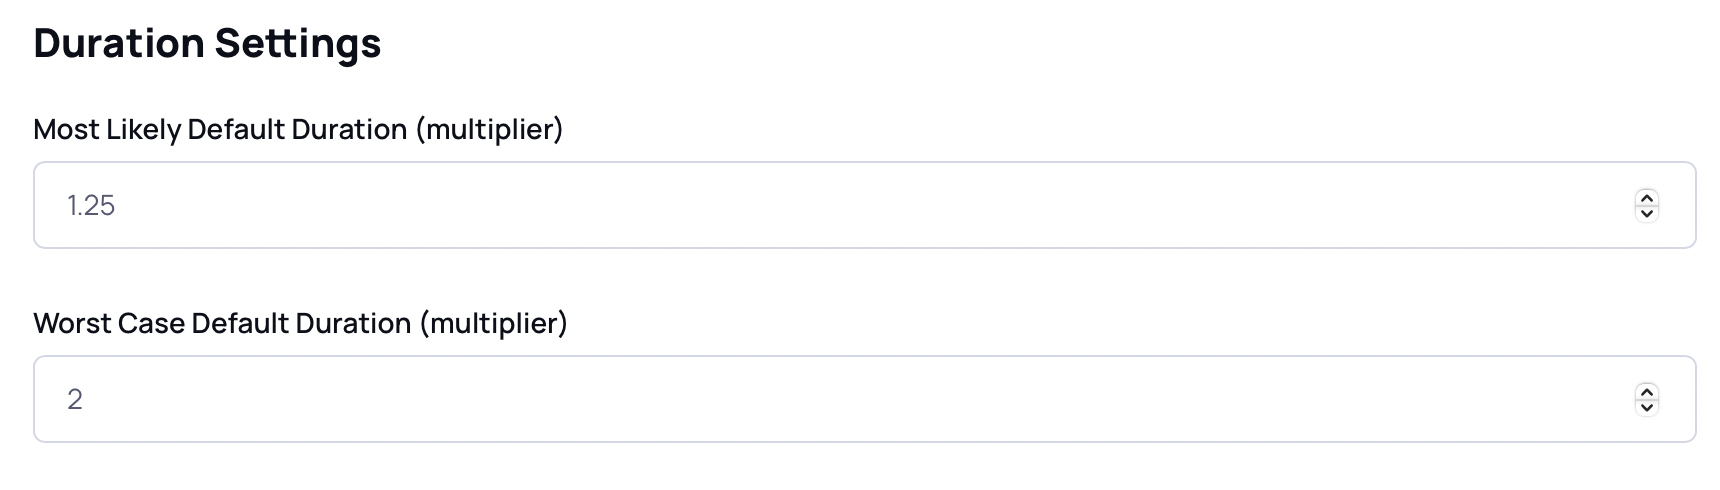
A lot of project simulations and buffer calculations rely on the various durations of a task; on the network editor you can enter the best case, most likely case and the worst case durations for each task.
The difference between best case and worst case dates are used in buffer calculations for the project and for the fever chart dashboards. The three duration types are also used for Monte Carlo simulations for predicting your project's completion dates.
On the network editor, only the best case duration is mandatory, if the other two durations are left empty, these settings are used. These values are used as a multiplier. As an example, if your task takes 5 days (best case duration), the most likely duration would be 1.25*5 or 6.25 days.
Adjust these to reflect the risk in your estimates or project or to align with your organizations default buffer schemes.
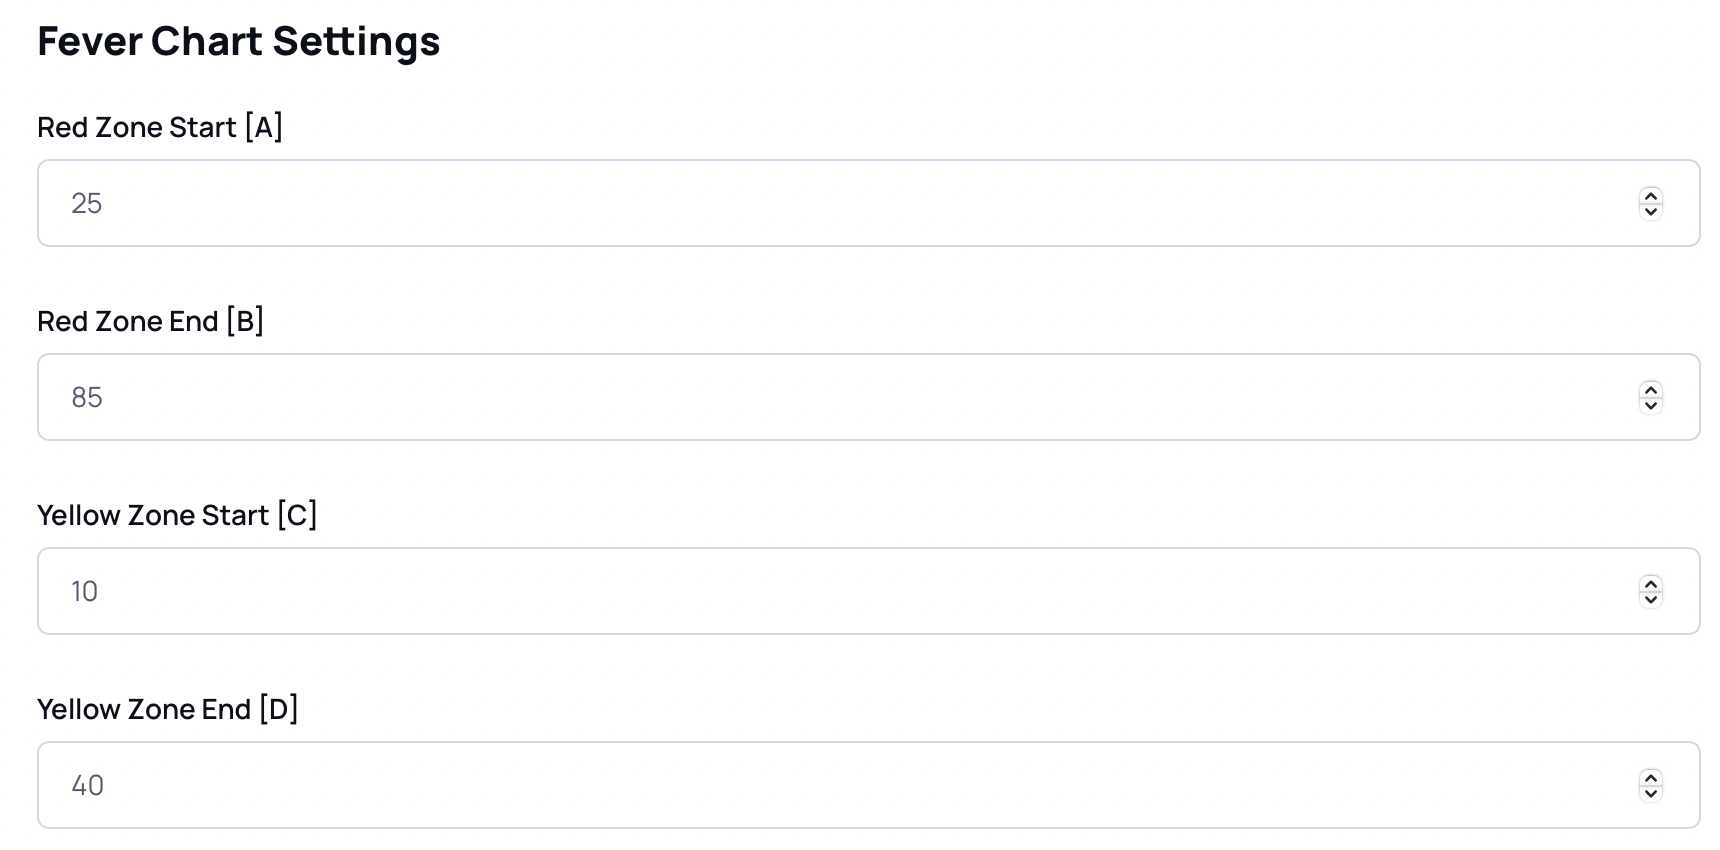
Fever Chart Settings
These settings change how the zones appear on the Fever Chart. They control the start and end of each of the Green, Yellow and Red zones. These settings are only for visual appearance of the fever chart; they do not change how buffers or completion percentages are calculated.
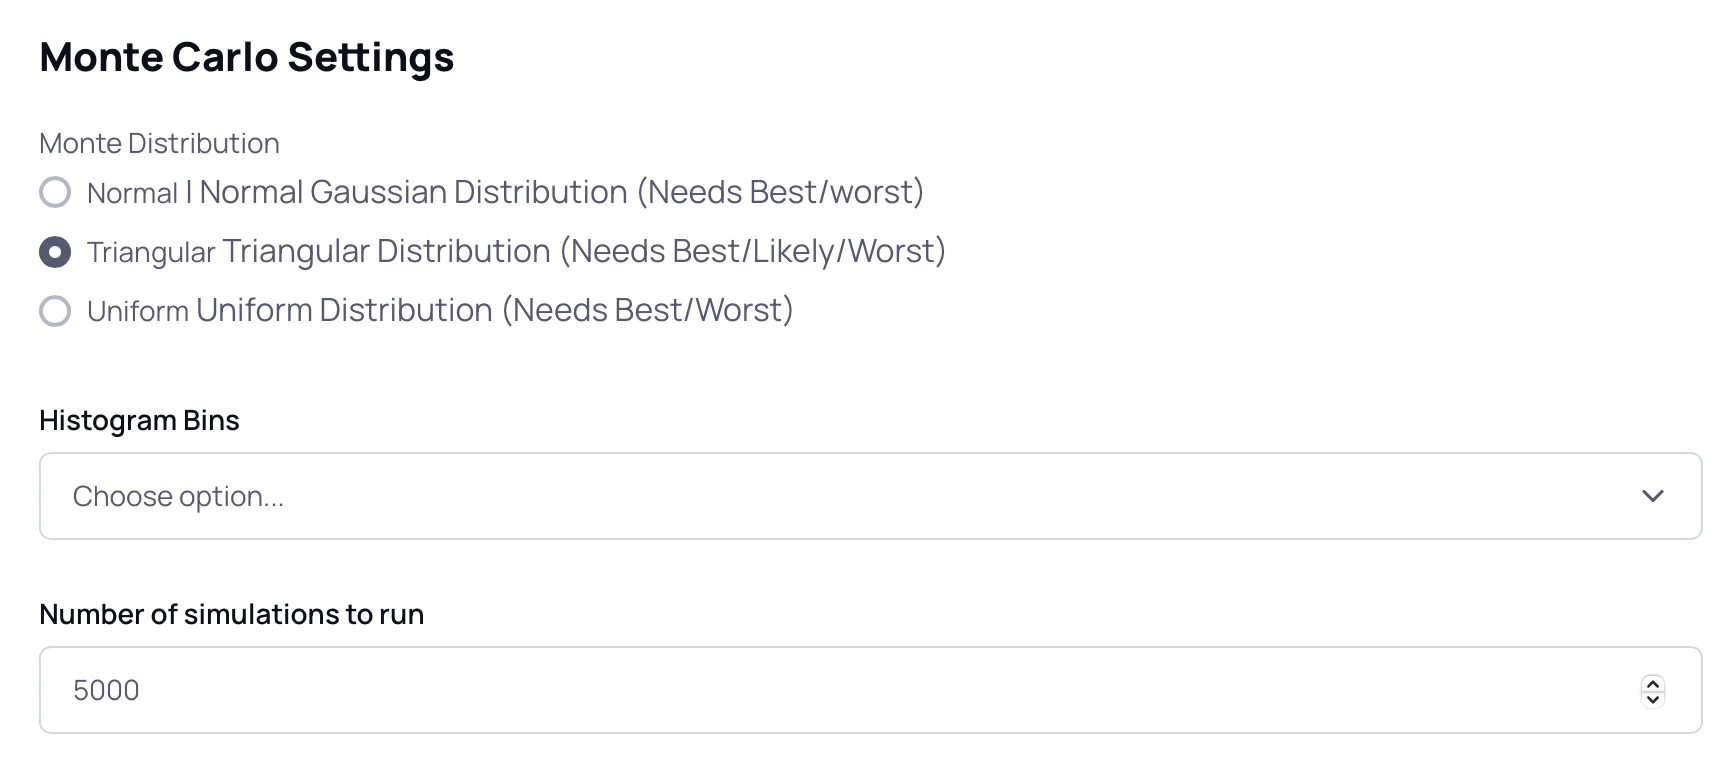
Monte Carlo Settings
Energer offers three distribution types for your monte carlo simulations; these distribution types change how the random durations are generated when running a monte carlo simulation. Watch the Monte Carlo Tutorial for an in-depth overview of these settings.
The histogram bins create "buckets" of date ranges for your histogram plots; pick a large number for a longer duration project and pick a smaller number for shorter projects. The number of simulations tell us how many iterations of Monte Carlo Simulations we should run for your project. Energer offers upto 10000 simulations for each project.
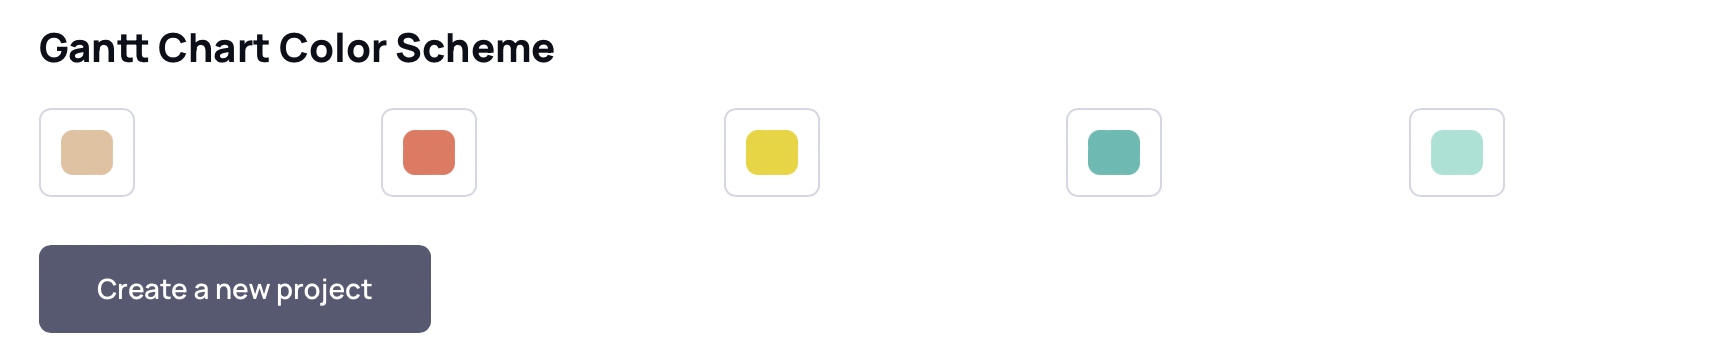
Gantt Charts
While the default color schemes work great, if you want to change your Gantt charts appearance; use this setting to change the color theme. Do note that these are not the exact colors we would use for the Gantt charts, but they inform us of your color theme. Depending on the number of swimlanes in your Gantt charts, we pick a color that's aligned to this theme. There is no limit to the number of swimlanes and we'll automatically adjust the colors of each swimlane to line up with your preferences. You can also use the color picker to align the Gantt charts to your organization's brand colors.
And that's it; click on the "create a new project" button and you are all set. Thanks for choosing Energer to serve your project management needs! The FAQ's below aim to answer a few popular questions we get.


Frequently Asked Questions
Energer was designed to be user friendly and intuitive; it offers a very simple drag and drop interface for building project schedules and it's a tool anyone can use irrespective of their professional background. Think of the network editor as a large whiteboard, where you are writing all things you need to do on PostIts and sticking on the whiteboard and then drawing lines between PostIts that depend on each other.
Energer's key user interface (the network editor) tries to mimic that whiteboard experience and does all the calculations and insights generation in the background so it is a great tool for any experience level.
We set out to create the most intuitive and simple way to generate a project schedule. We also wanted to ensure standard items like dashboards, charts and project metrics are never more than a single click away. The way we designed Energer was to automatically do all the complex things one would need to manage projects, "under the hood", so no more exporting your project to another tool, changing 50 different settings and setting things up just right, just so you can export a Gantt chart. Our Gantt chart (and every other feature we offer) is automatic and a single click away (always synced and updated).
We make it easy, user friendly and most importantly all inclusive. You don't need another tool to manage your project.
The number of projects you can create depend on your subscription type, our free plans allow only for 1 project. The number of available projects is listed on your account dashboard page. If you need to open more projects than what's allowed, you can either upgrade your subscription type or delete an older project. Keep in mind that deleting a project deletes everything associated with the project (Progress updates, notes, resources, charts, simulation data etc.) and is not reversible.
All our tutorial videos are listed here on our website and available on youtube. Additionally we plan to offer case studies where you can follow along the journey of a project manager as they use Energer in their day to day work.
We currently do not have classroom type sessions; however if you are a PMO getting all PMs trained on Energer, reach out to us via email or social media and we can create something for your needs (Though we feel that Energer is so intuitive to use and so user friendly that anyone can start taking full advantage of Energers tool in no time).
These settings are used during execution of any project algorithms; so if you make the change and run a new monte carlo simulation, the updated settings are automatically used. If your project already was "synced" and has a baseline buffer and end date, changing these settings wont change those buffers. If you want to utilize the new settings for calculations of those buffers, please click on the "Reset project Baseline" button at the bottom of the edit project settings page. Do note however that all your progress calculations will reset and new buffers will be calculated.