Create a Gantt Chart
Generate a stunning Gantt Chart for your project schedule. Watch the tutorial video or feel free to read the instructions and follow along.
Need help?
Just contact us via the contact form below and we'll be happy to assist you.
How do I generate a Gantt view for my project?
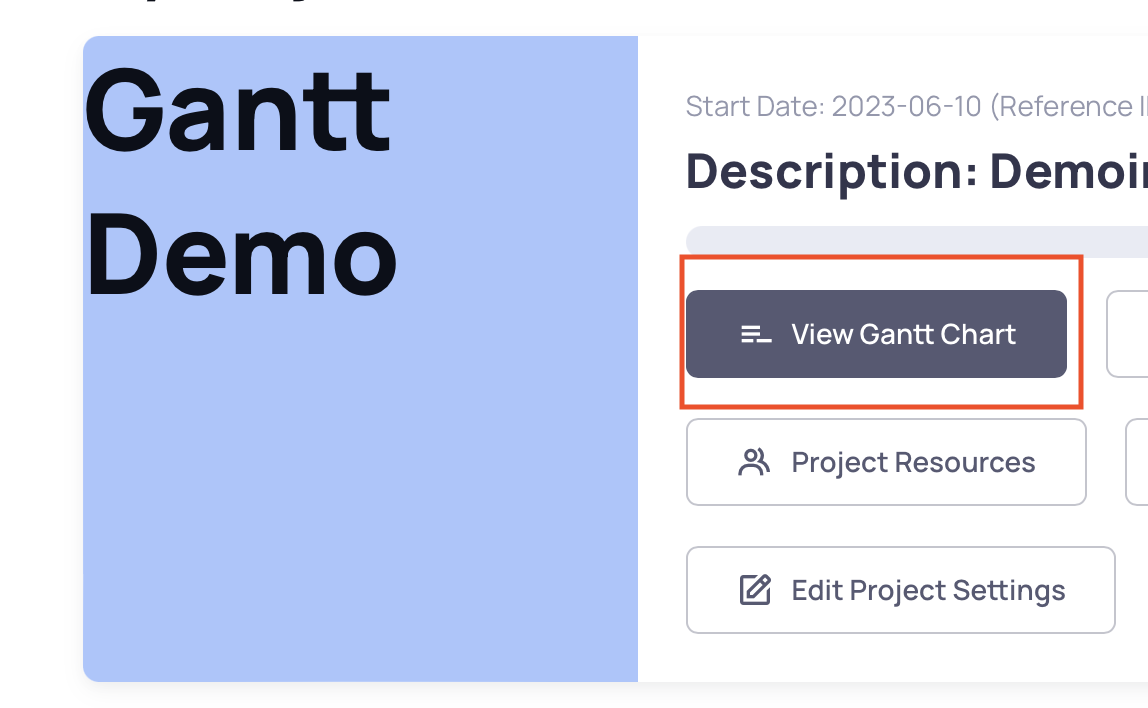
Click on the Gantt Chart button
You can click on the Gantt Chart button on the project dashboard or on the network editor. If you haven't already added tasks to your Gantt chart, this graph will be blank.
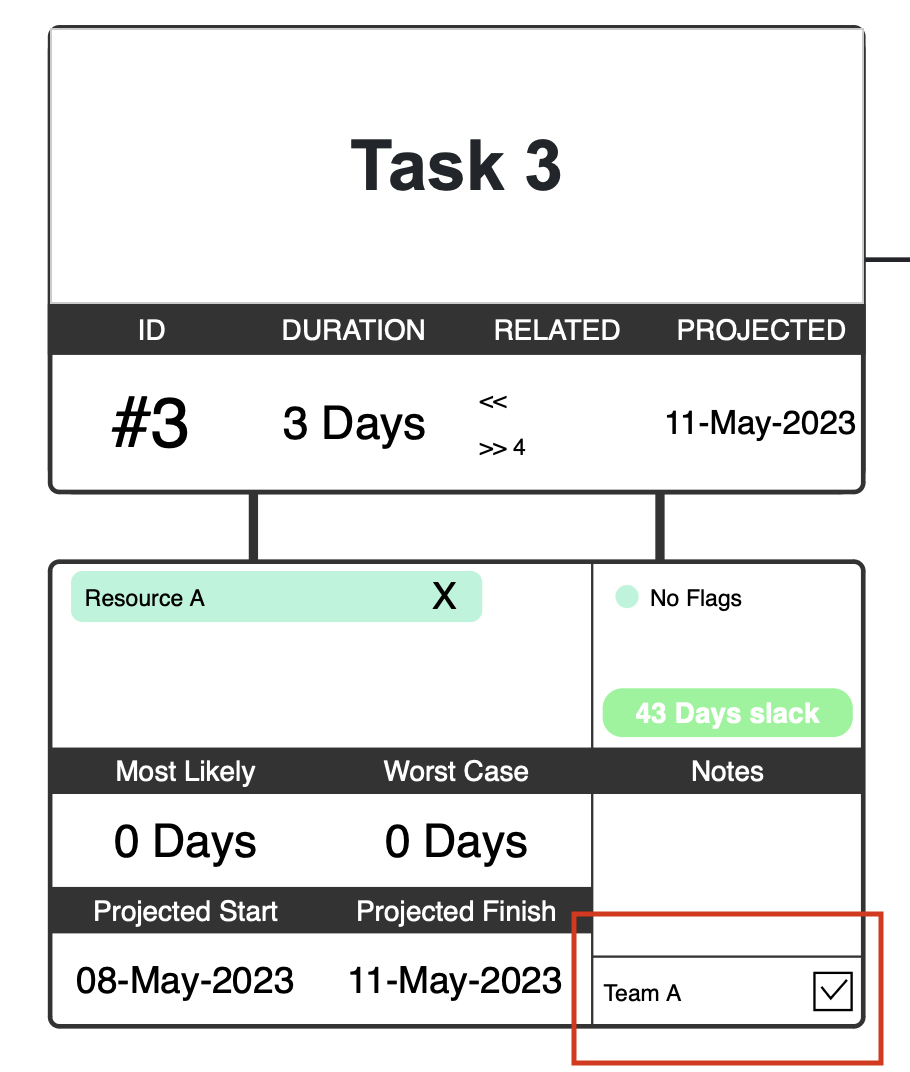
Select the tasks on the network editor to show on the Gantt Chart
Right click on a task (or double click on it) to pull up the details box.
To add a task to be visible on the Gantt chart, simply select the checkbox in the bottom right of the second box as shown. Go back to the Gantt chart view from the step above and refresh your page to see this task added.
Make sure the project is updated to ensure the Gantt chart shows the latest information.
Add additional tasks or automatically add all tasks to the Gantt Chart
You can repeat the previous step for all tasks you would like to see on the Gantt. Unchecking the box removes it from the Gantt Chart (all new tasks are hidden by default). Notice that critical path tasks will be highlighted on the Gantt.
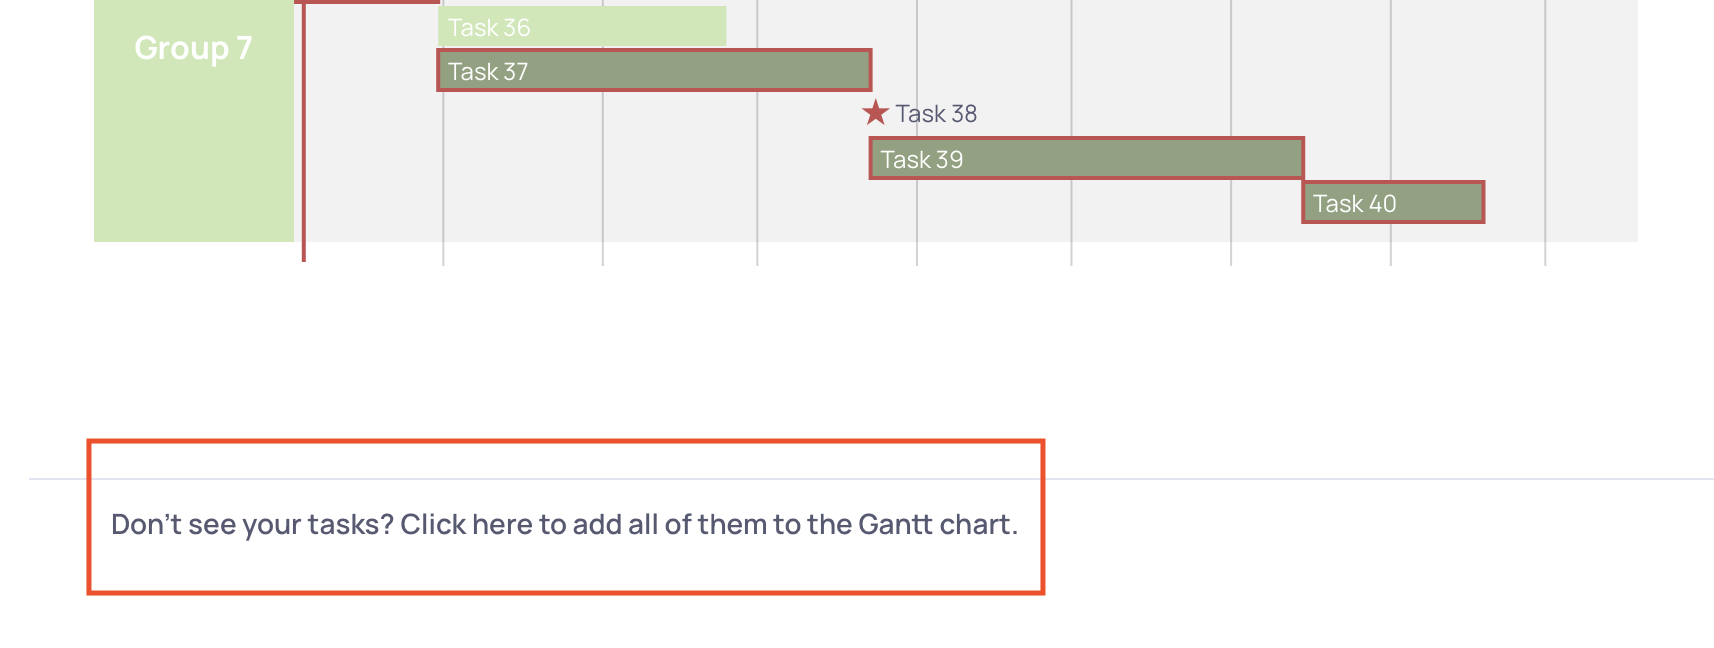
To automatically add all tasks to the Gantt, click the button shown. Do note that once added, you'll need to go to tasks to uncheck the boxes to remove them from the Gantt.
Add Swimlanes and organize your tasks
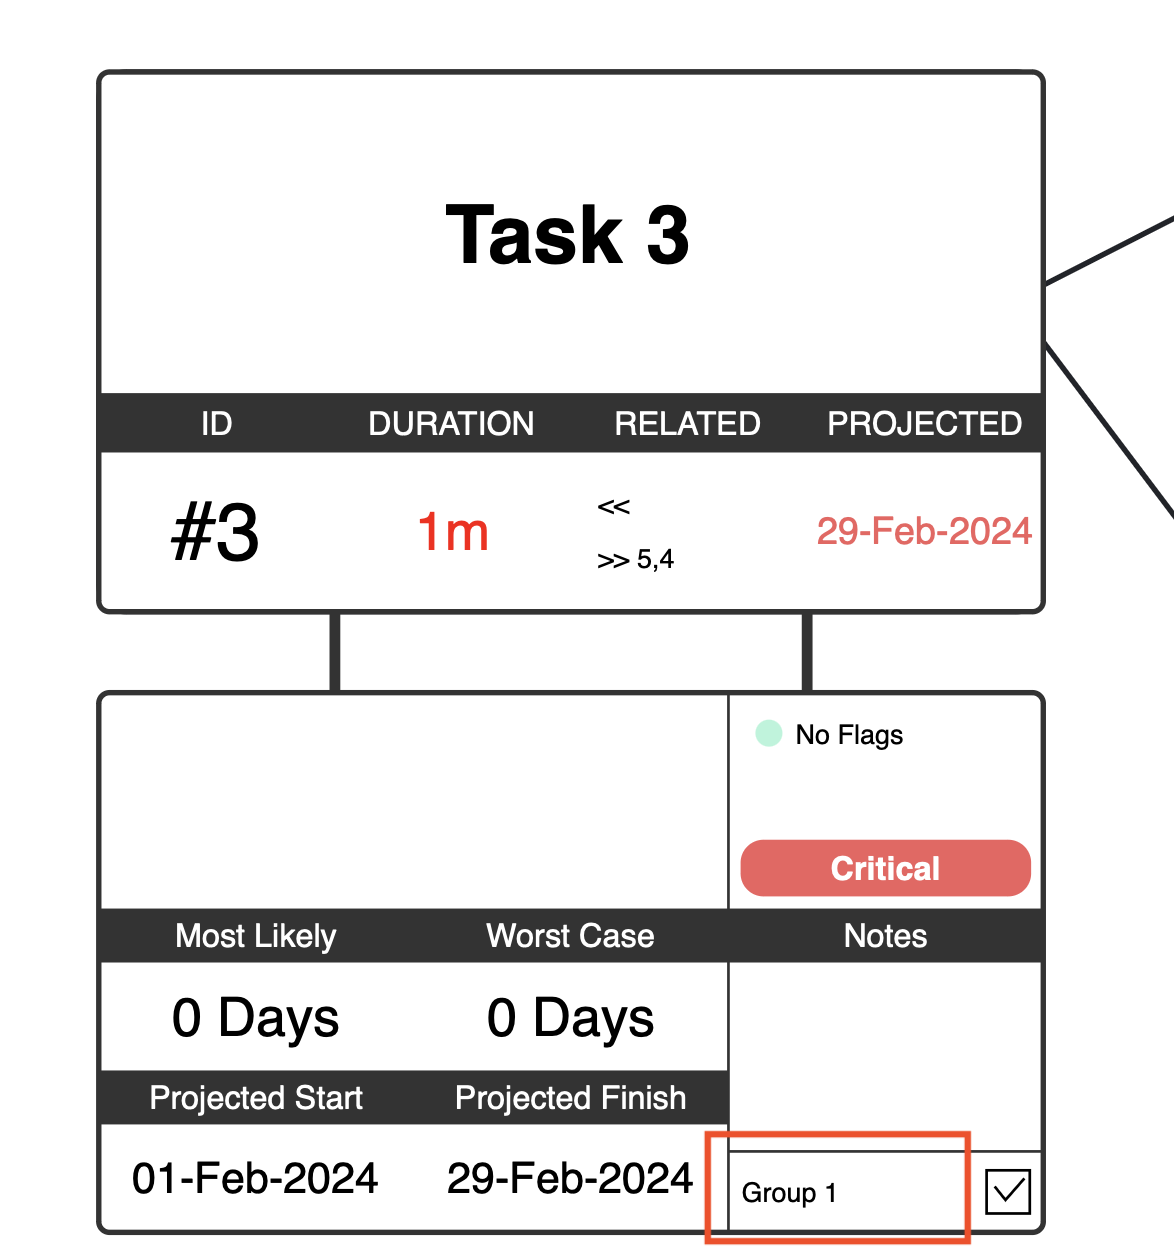
All tasks get added to the default swimlane, if you would like to separate tasks into multiple swimlanes, simply add a swimlane name on the box as shown.
Continue to add swimlanes labels to tasks, you can have as many swimlanes as you need.
Moving and zooming in/out
You can rearrange the tasks within a swimlane by simply dragging them; they will snap to the grid when you let go. You can do the same with the entire swimlane as well.
Once you are happy with the layout, you can download an image of the Gantt Chart. To undo all your changes, just refresh your page (note that these changes are not saved).
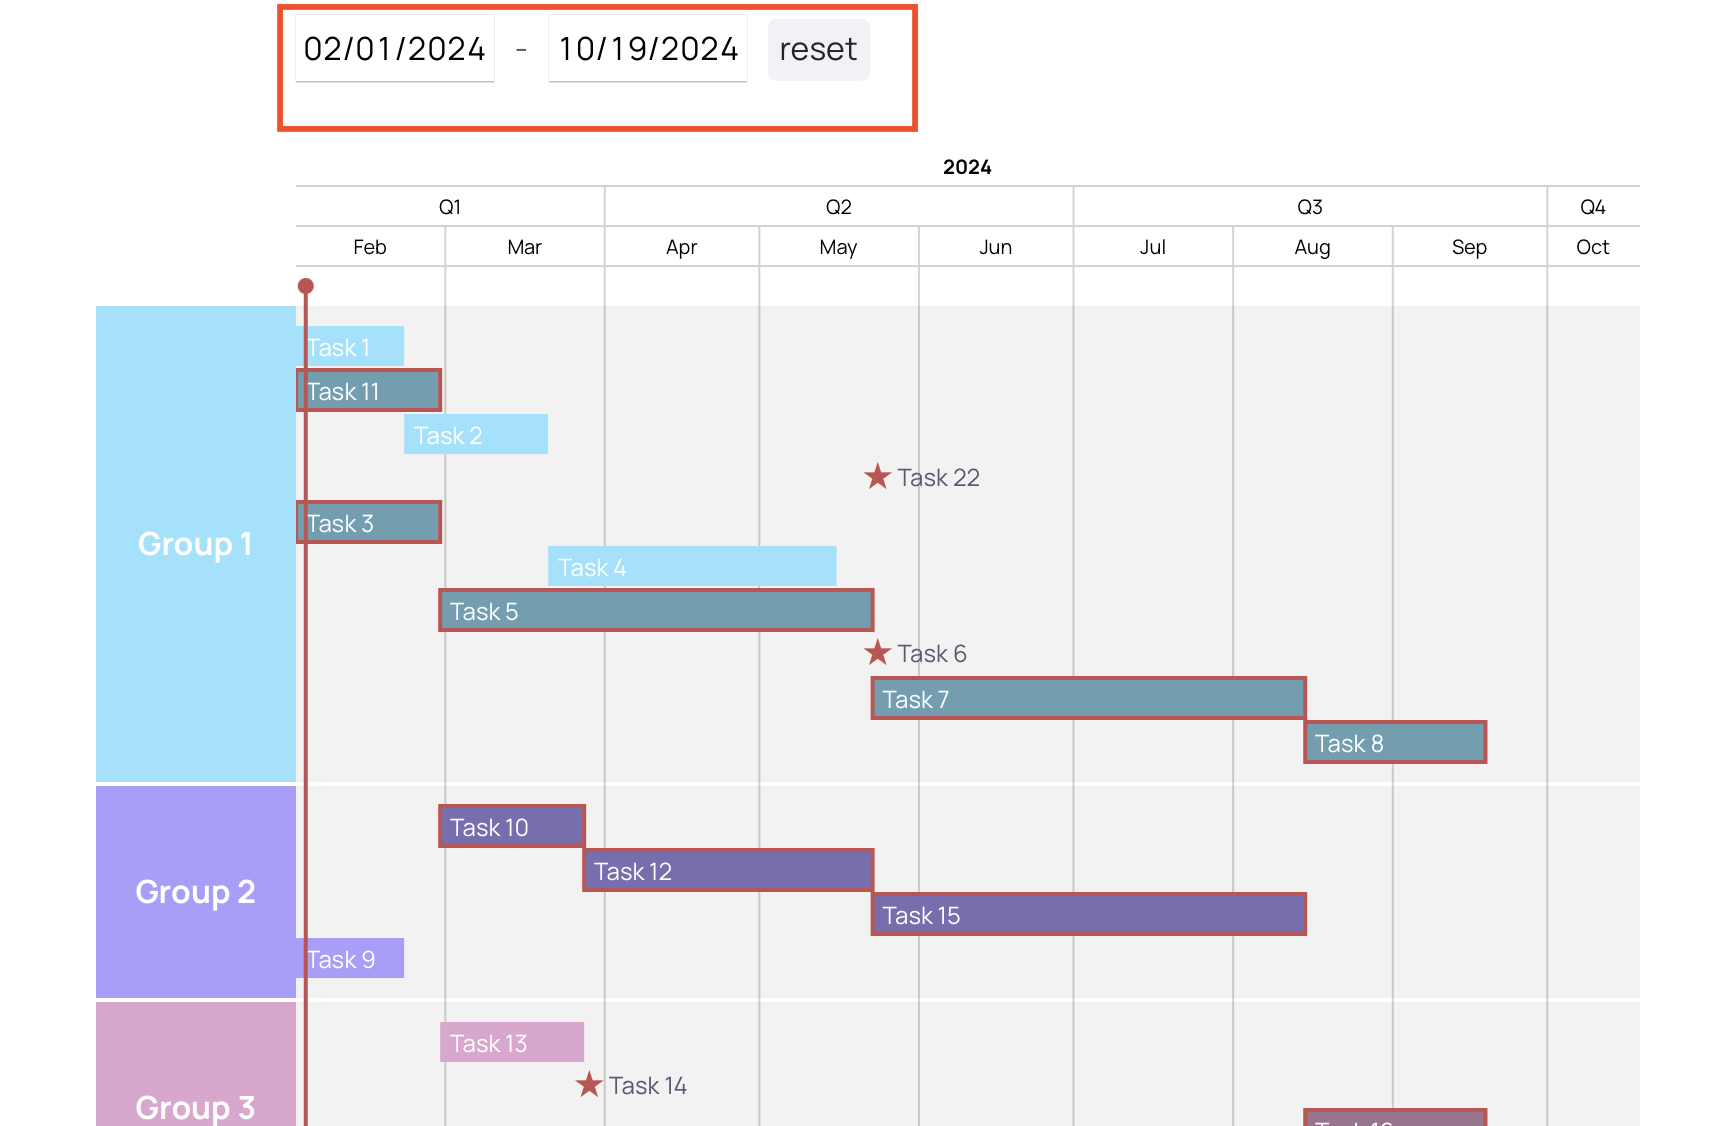
For a more focussed Gantt Chart (such as looking at tasks specific to a single quarter) you can adjust the start and the end dates; this will display the Gantt charts only for tasks within the selected window.
Change the look and feel
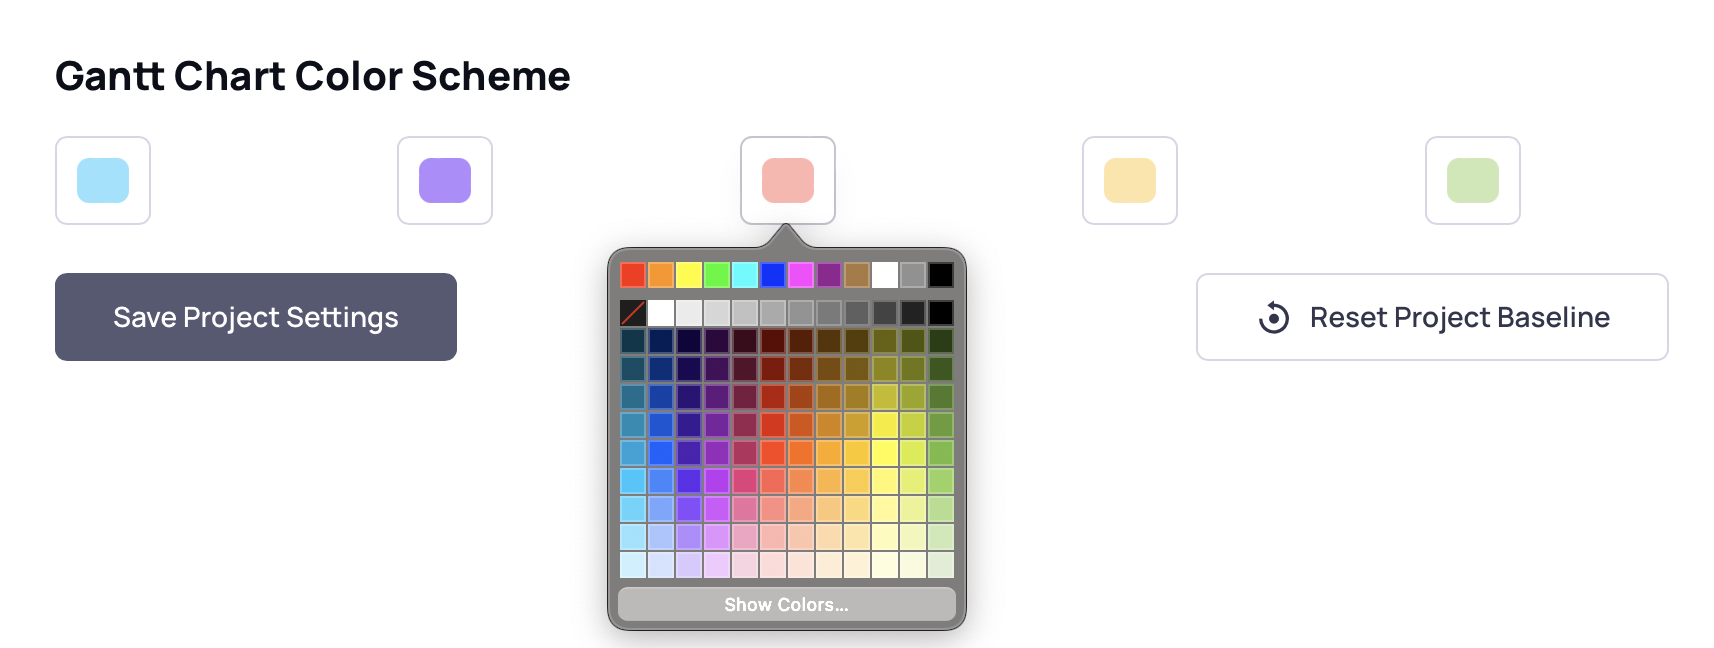
Go to the project settings (either via the network editor or from the project summary page); at the bottom of the settings, you'll see the Gantt Chart color scheme section.
Click on each of the 5 colors and pick a theme to your liking, you can also use the eyedropper function to pick specific colors (to align with your corporate branding or project colors).
Energer automatically scales all swimlanes to align with the color theme you picked, so even if you have a large number of swimlanes, the color of each swimlane aligns with the theme you select here.
Other features
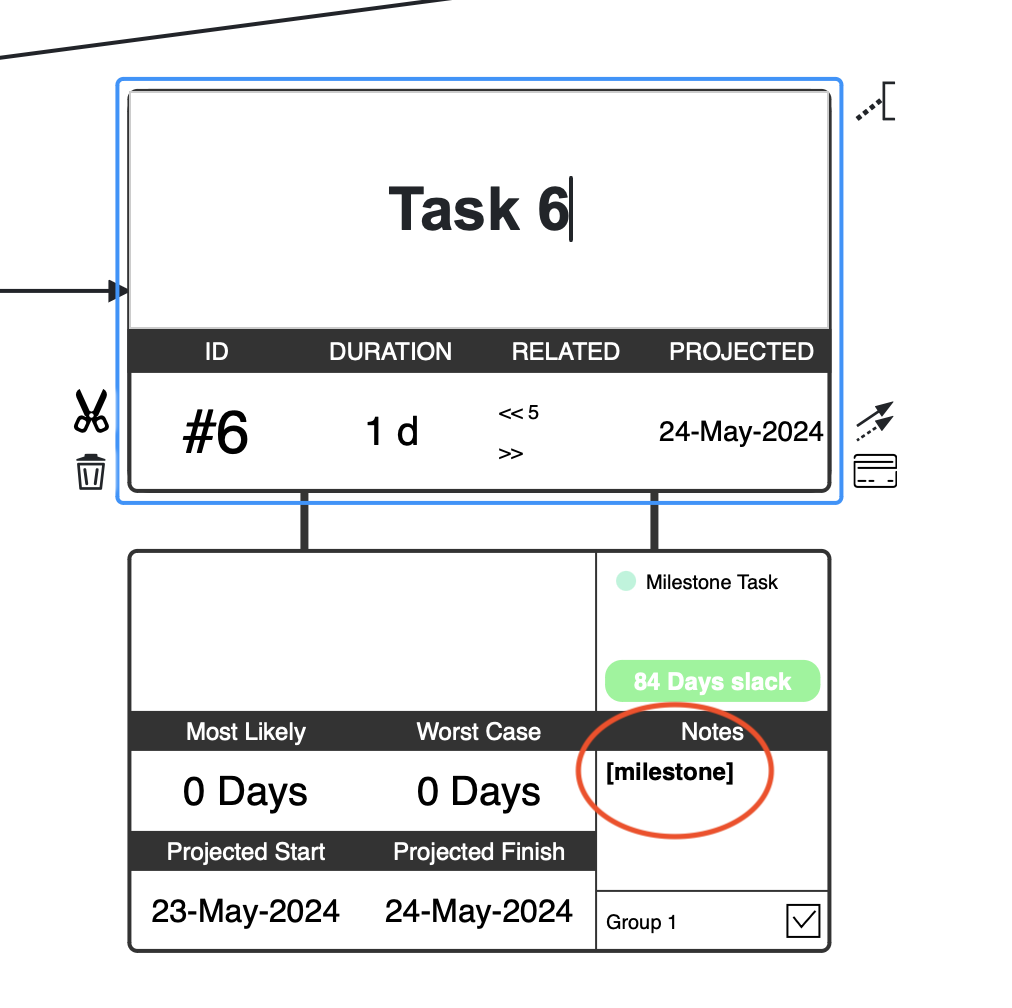
To add a milestone task, simply add "[MILESTONE]" within the notes section of the task. This makes the task appear as a Star on the Gantt Chart.


Frequently Asked Questions
If you added tasks but don't see anything on your Gantt Chart, most likely, you did not update your schedule (or the project has never been scheduled). Make sure you can see projected dates on tasks on the network editor. Without the project being scheduled (by clicking the update button on the network editor), the tasks do not have their start and end dates and thus the Gantt Chart appears empty.
This feature is under Beta testing, please reach out to us via the support page to enable it on your account.
The Gantt color themes are project specific, so changing settings in one project should not impact others. There are Beta features we are testing that can apply custom themes to all your projects. Feel free to reach out if you like this enabled on your account.
On the network editor, select the critical path filter, for each of the tasks shown, add the same swimlane tag and enable it. This will ensure all critical path tasks are shown.
Note, you'll have to do this each time your project refreshes as the critical path might have changed. By default, all critical tasks are highlighted on the Gantt Charts by a red border.
Absolutely! On the top of the Gantt Chart page, you can select the two date ranges; this will automatically focus your Gantt chart between those two dates. Clicking on save image will save that specific view. Use these for your weekly meetings, or quarterly reports.